How to Set Up JMeter, InfluxDB, and Grafana Locally for Performance Monitoring
Introduction
When it comes to performance testing, it’s not just about running the tests—it’s also about understanding the results. That’s where data visualization comes in. Instead of sifting through raw numbers, you can use dashboards to see your test results in real-time and spot trends or issues easily.
In this article, I’ll show you how to take your JMeter performance test results and bring them to life in a Grafana dashboard. To do this, we’ll use InfluxDB as the database to store your test data and Grafana to create beautiful, interactive visualizations.
Whether you’re new to performance testing or just looking to improve your reporting, this step-by-step guide will help you set up everything you need in a local environment. By the end, you’ll have a working setup that lets you monitor and analyze your test results like a pro!
1. Prerequisites
Before we get started, make sure you've downloaded JMeter and have a sample JMeter test script ready
1.1 JMeter installation and create a test script
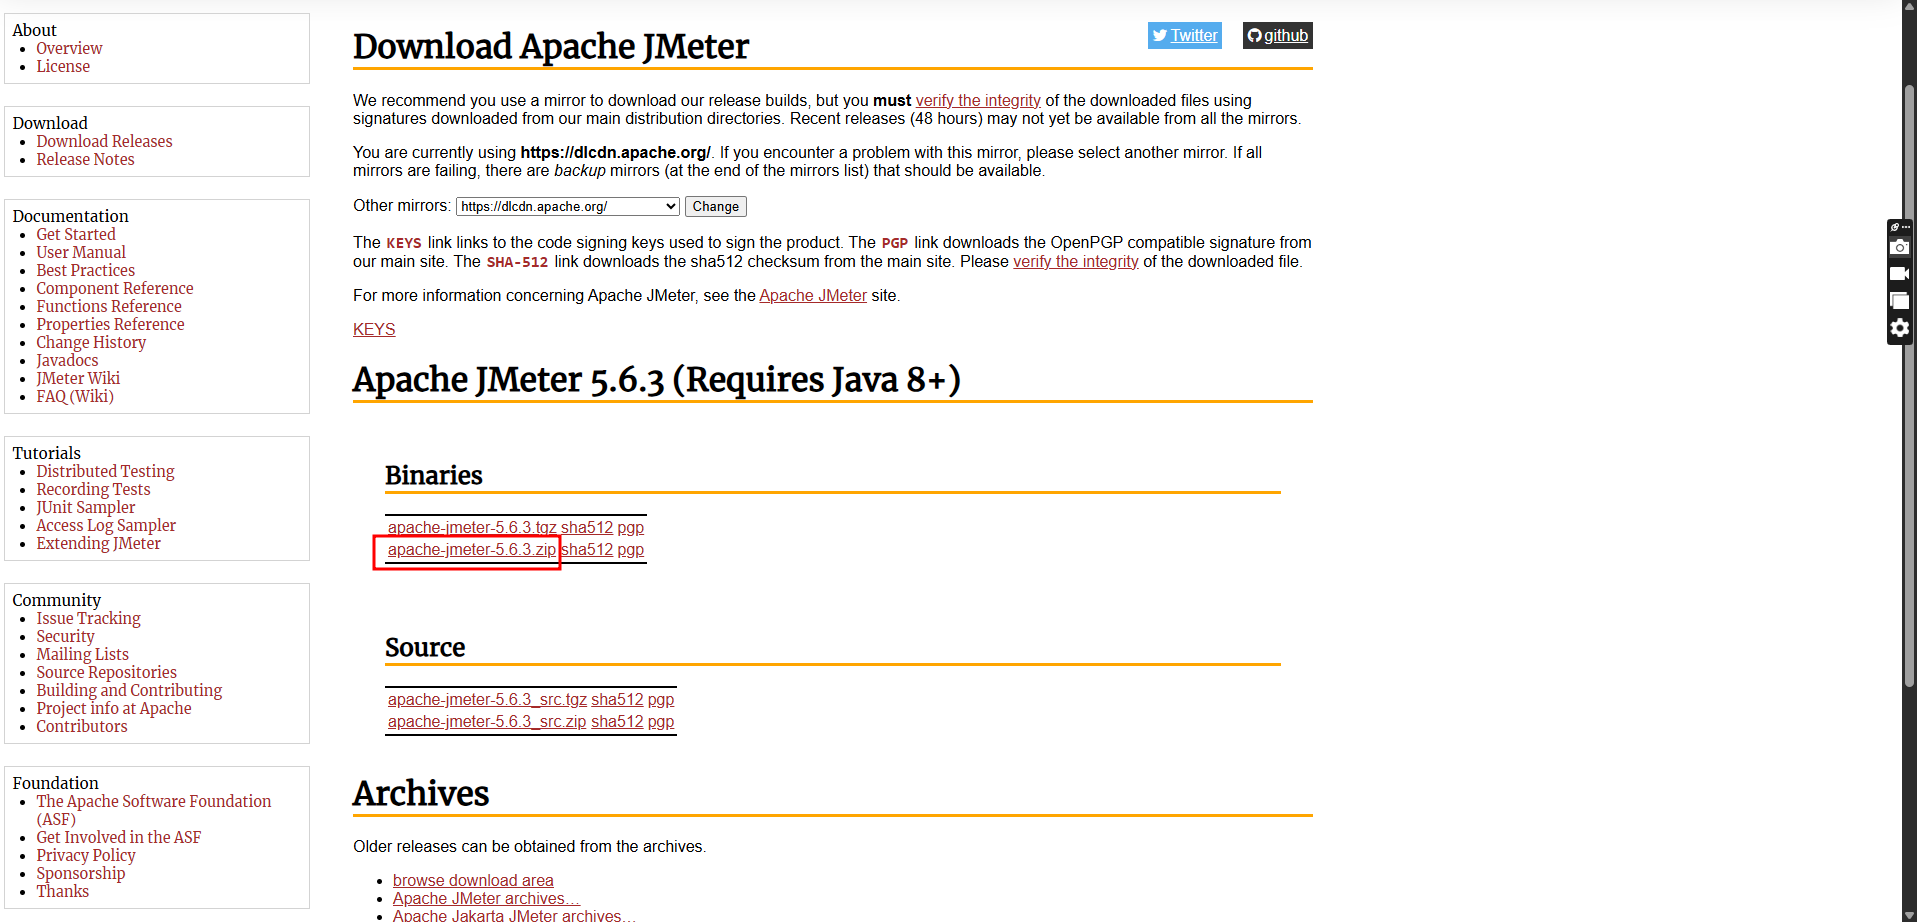
- Download JMeter and extract it to a location of your choice
- Create a sample JMeter test script
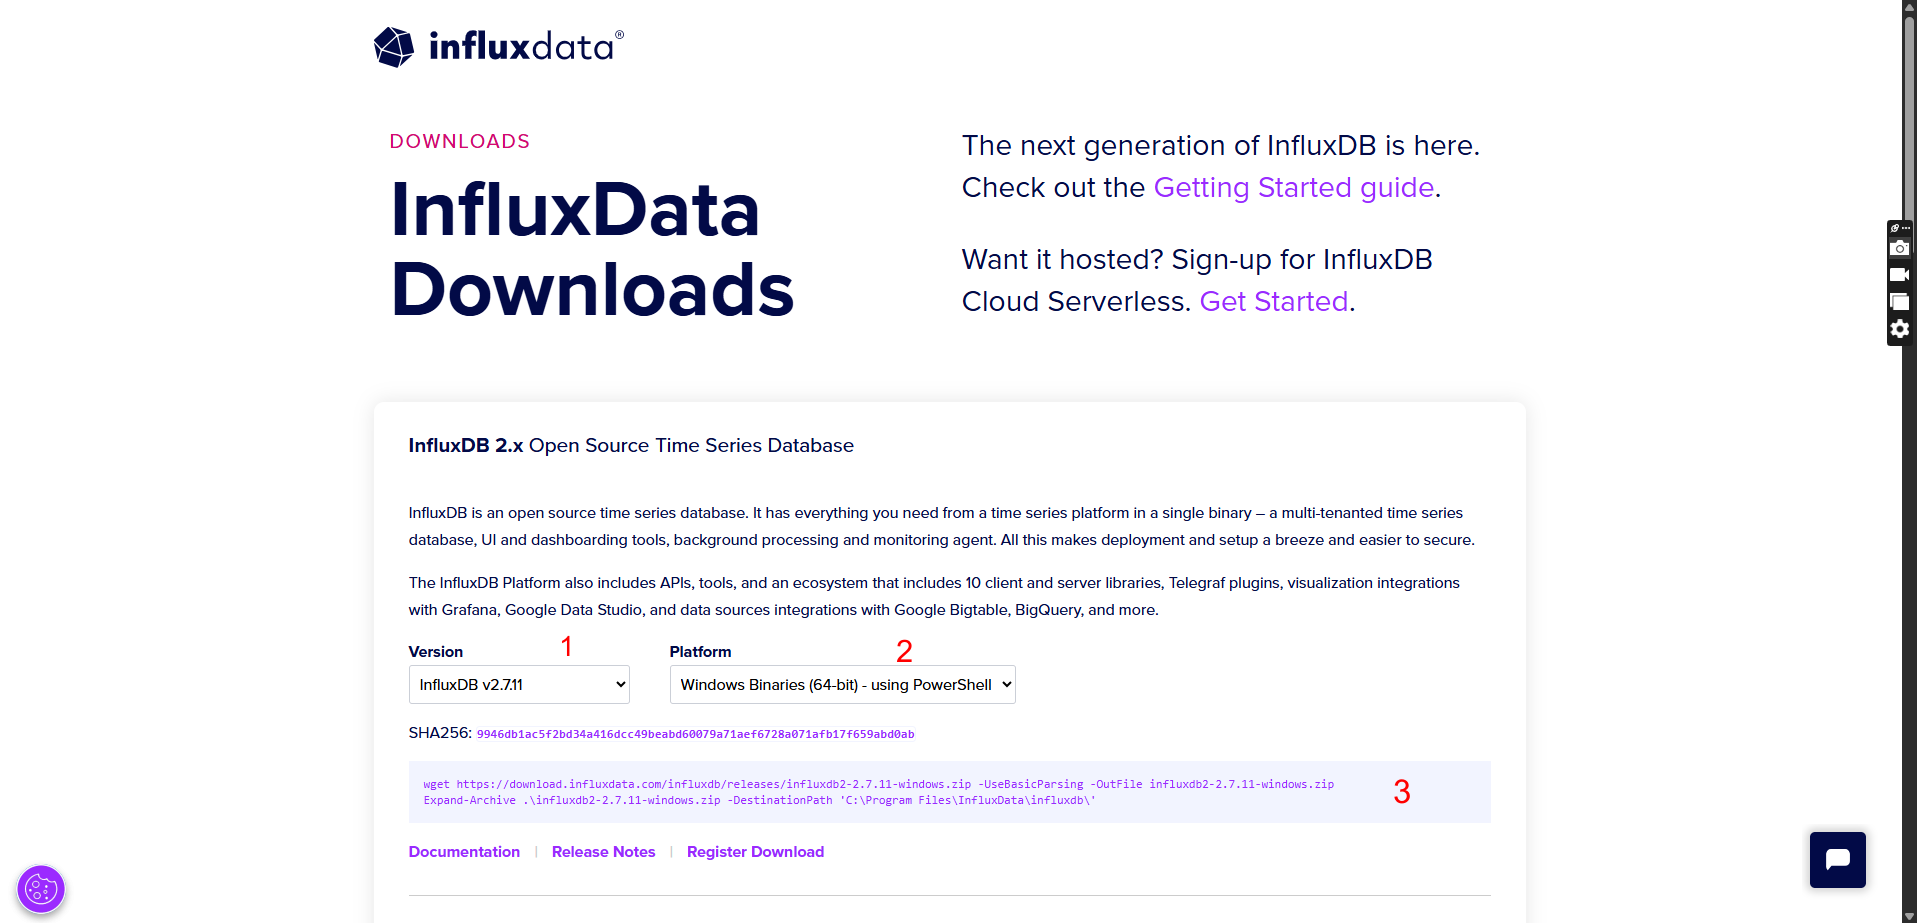
- Go to the InfluxDB download page
- Select the version and platform you want to download
- Copy that installation command and execute it using PowerShell it will download influxDB and install in the "C:\Program Files\InfluxData\influxdb\" directory
This GitHub repository contains sample test scripts for creating an employee in OrangeHRM demo website
2. Setting up the environment
2.1 Installing InfluxDB
or else you can download separately and extract it "C:\Program Files\InfluxData\"
- Go to the location where InfluxDB is extracted and run the executable file using Command Prompt. Once executed, it will display the port numbers to access InfluxDB locally
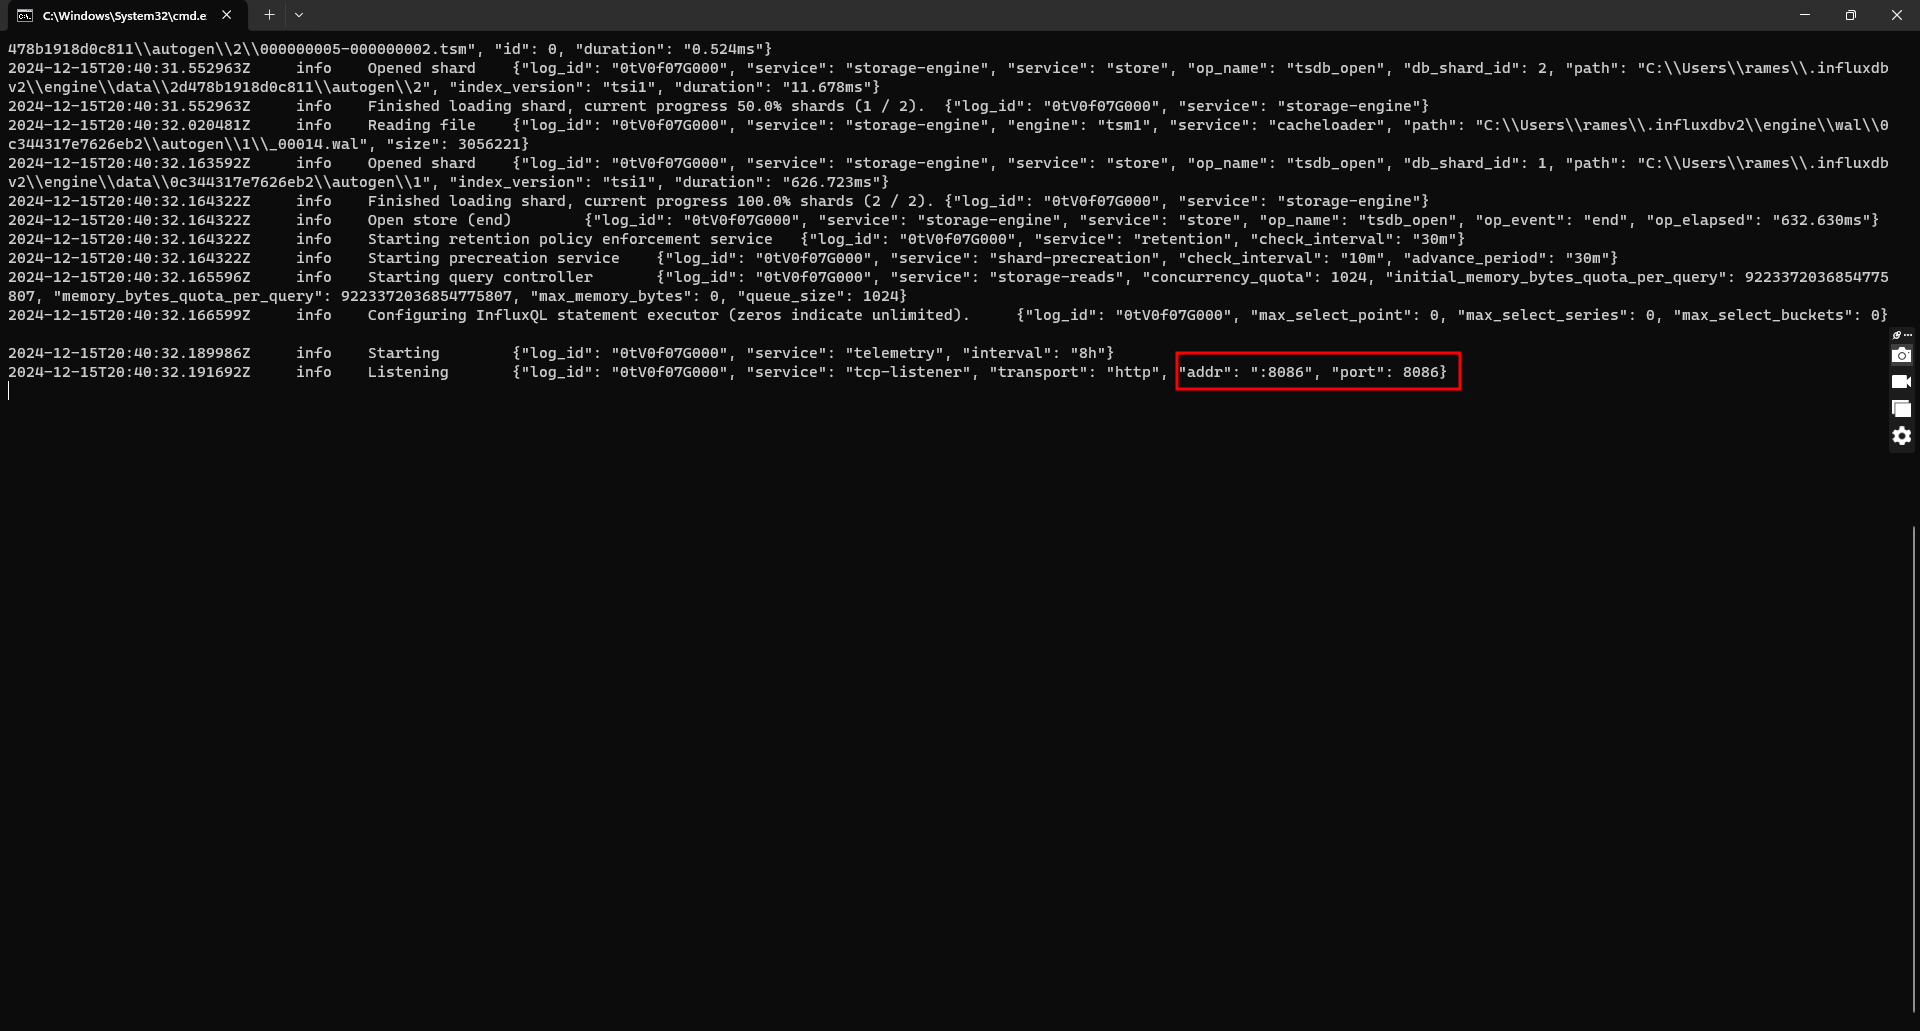
- Open your browser navigate to http://localhost:8086
- If you are accessing the InfluxDB web interface for the first time, it will prompt you to set up your initial user. Once the setup is complete, an API token will be generated, or you can create your own API token later and stored securely for future us.
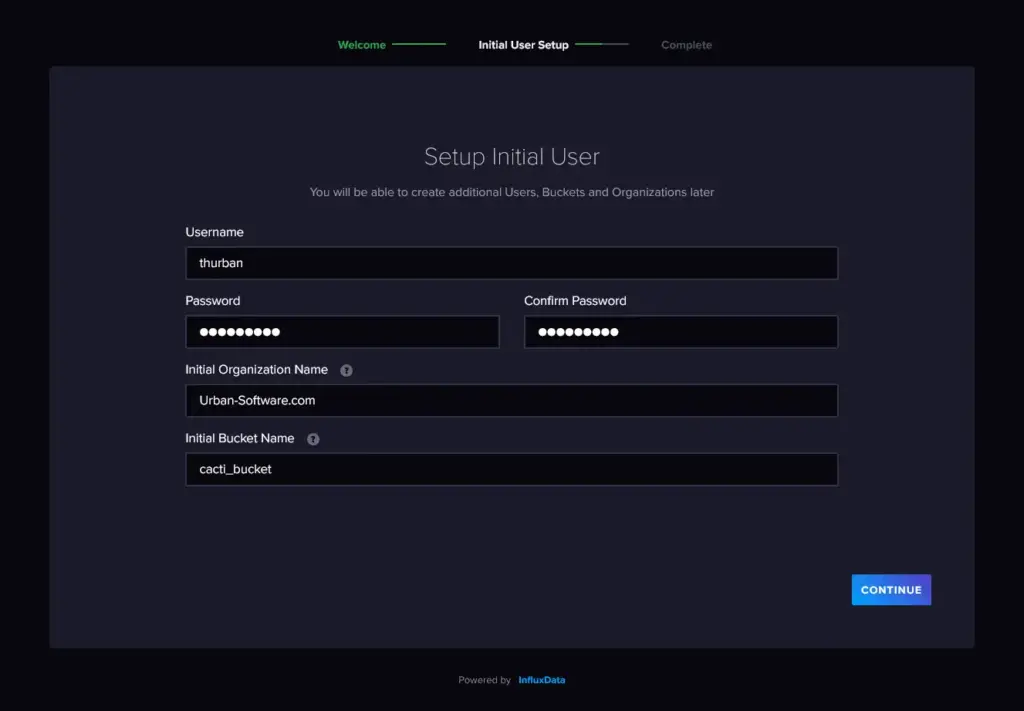
- After clicking the 'Continue' button, you will be redirected to the final step. In this step, click 'Quick Start' to navigate to the InfluxDB dashboard.
2.2 Installing Grafana
- Navigate to Grafana Download page
- Select platform you want to download
- Download Grafana installer and install the setup
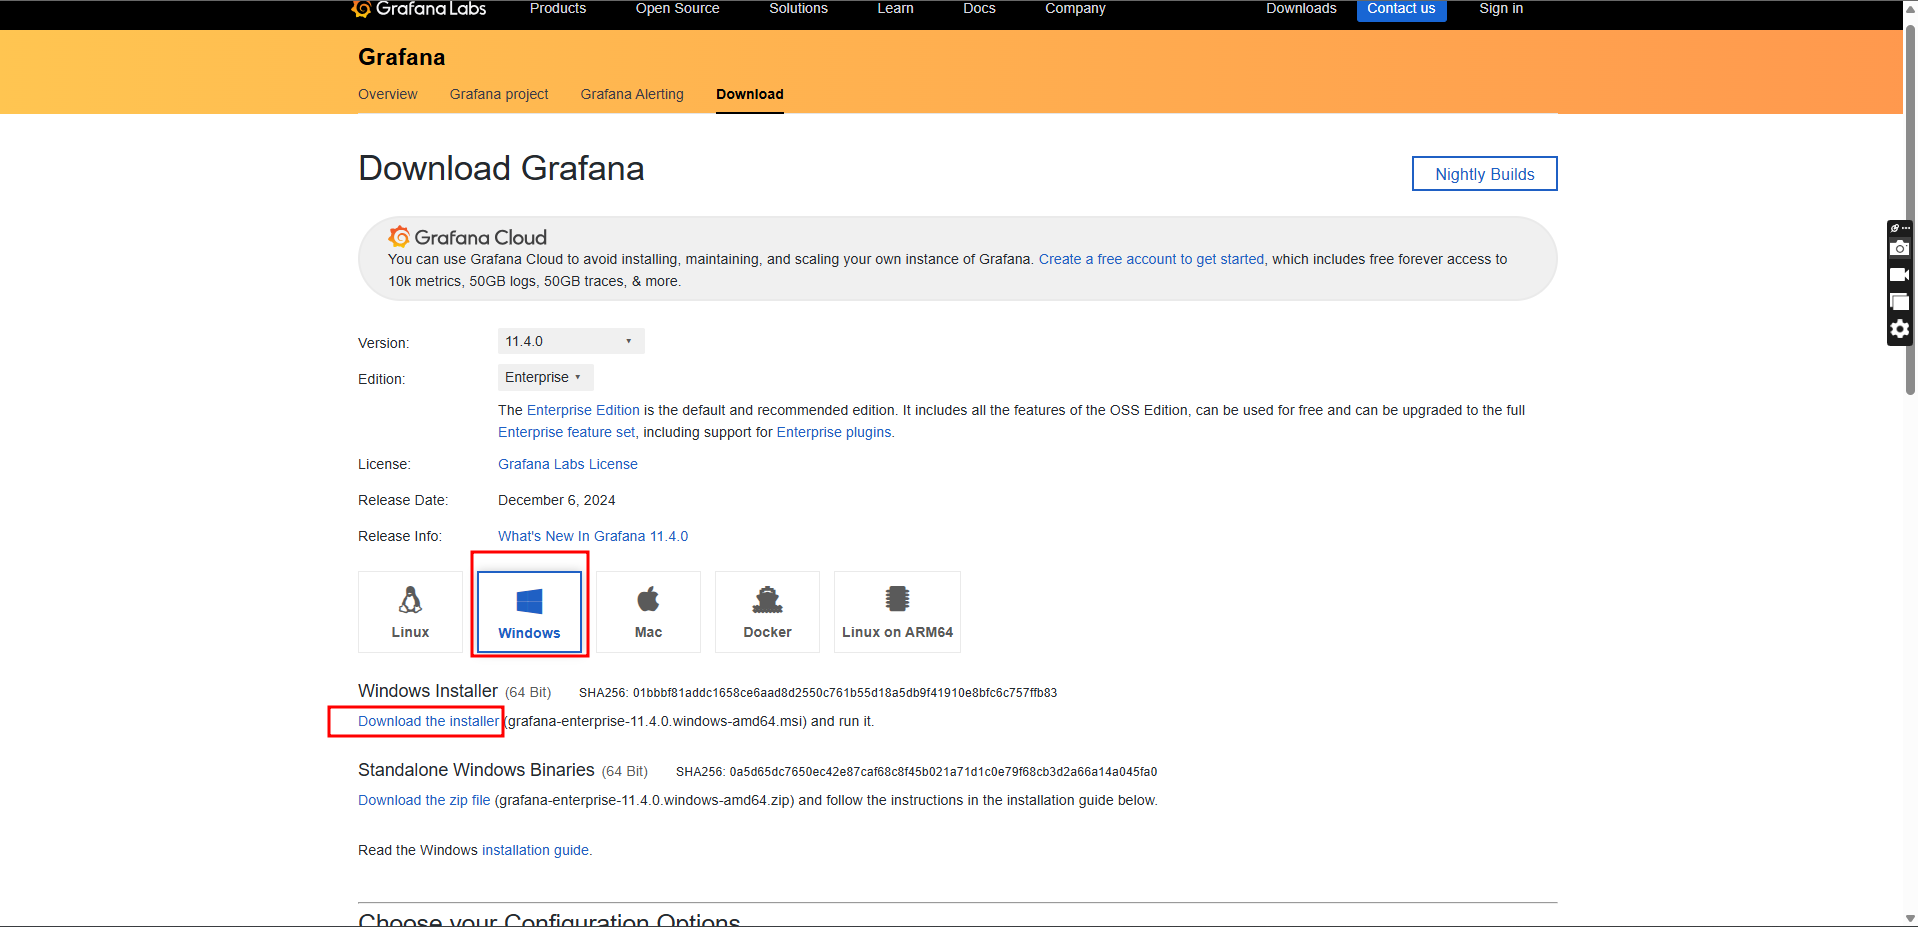
- Once you finish installation Grafana will be already running as a service
- Open browser and navigate to http://localhost:3000
- Enter "admin" for both username and password
- Click "Login" button you will navigate to home page
3. Configuring JMeter to Send Data to InfluxDB
- Open JMeter with sample test script or create a new test script
Tip: If you're creating a new test script, use the BlazeMeter Auto Correlation Recording Plugin. It will identify dynamic values and handle them automatically.
- Add backend listener to the thread group and need to some configurations to the backend listener
- Change "Backend Listener implementation" to 3rd option in the list which is "org.apache.jmeter.visualizers.backend.influxdb.InfluxdbBackendListenerClient"
- Update "indluxdbUrl" to influxdb write API("POST http://localhost:8086/api/v2/write)
- Provide the organization name and bucket name created during the InfluxDB initial setup as query parameters to the API http://localhost:8086/api/v2/write?org=[organization_name]&bucket=[bucket_name] e.g.: http://localhost:8086/api/v2/write?org=JIG&bucket=jmeter
- Add API token to the backend listener that you stored earlier during the InfluxDB initial setup as an additional parameter
- Click the "Add" button located at the bottom of the Backend Listener to create a new field.
- In the newly added field, enter "influxdbToken" as the name. Note that this variable name is case-sensitive, so ensure it is entered exactly as shown.
- Provide your API token as the value for this field and save
- You can optionally change the application name and test title, but it’s not mandatory
- Run your test
- Go to InfluxDB and navigate to "Data Explorer"
- Select your bucket
- "Select 'jmeter' under the measurement filter. If you changed the default measurement name in the Backend Listener, the updated name will appear here.
- The next field will show all the data being sent from JMeter to InfluxDB.
- Select the data you want to display and submit it. InfluxDB will then present the selected data as a graph
What is happening here is when you add a Backend Listener in JMeter and configure it with the InfluxDB API and token, JMeter sends performance metrics to InfluxDB during the test. InfluxDB stores this data, and you can later visualize it in tools like Grafana for analysis.
4. Setting Up Grafana to Visualize JMeter Data
4.1 Connecting Grafana to InfluxDB
- Navigate to Grafana
- Go to "Conncetions -> Data Sources" and click "Add New Data Source Button"
- Select 'InfluxDB' as the data source, as the data will be retrieved from InfluxDB.
- Select query language as "Flux"
Flux is a data scripting and query language by InfluxData for InfluxDB 2.x, designed for advanced data analysis and integration with various sources. It uses a functional approach with powerful operators and functions for time-series data transformations, analytics, and more
- Set the HTTP URL to the InfluxDB address, usually http://localhost:8086. If you're using Docker, enter the container's IP address. For secured URLs, enable 'Basic Auth' and provide the username and password.
- Under "InfluxDB Details" section give you're organization name, bucket name and token
- Click "save" button if the connection is successful a success message will display
After successfully connecting InfluxDB to Grafana, you can visualize the data stored in InfluxDB.
4.2 Create Custom Dashboards
- Navigate to "Explore"
- Select your data source using the dropdown in the top of the screen
- Click on 'Sample Query' and select 'Simple Query'; this will display a simple Flux query that retrieves data from a specific measurement and field within the last hour from the given InfluxDB bucket
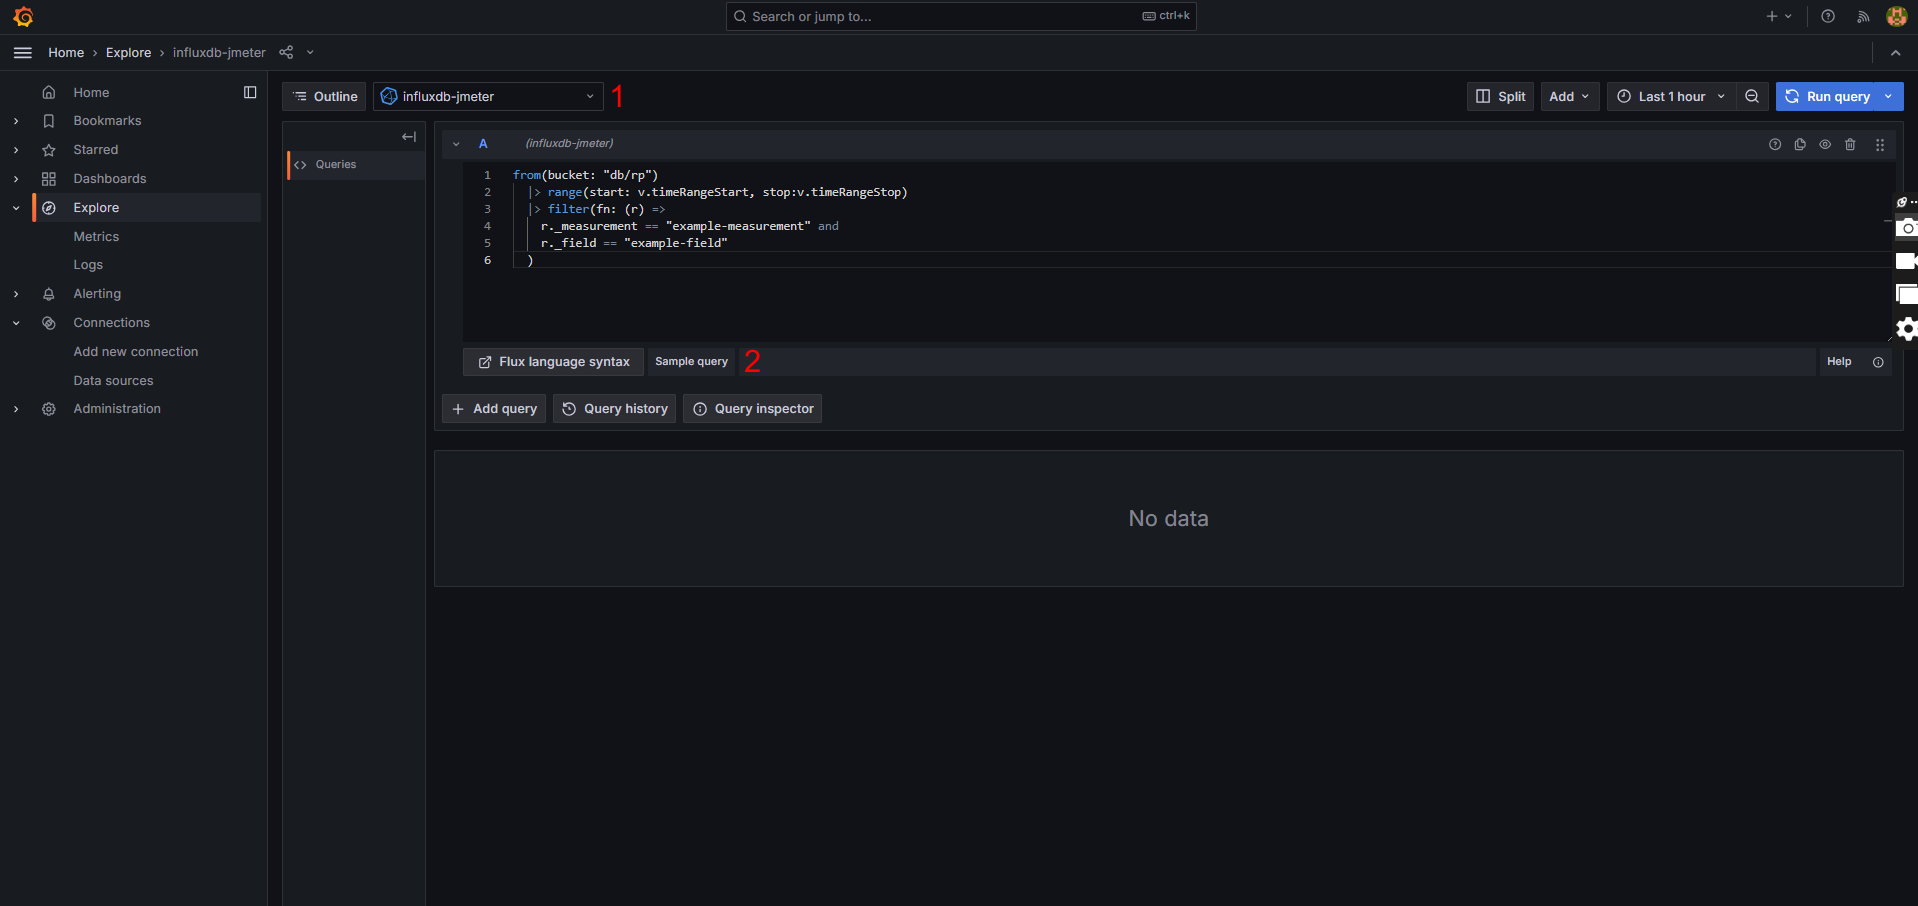
- Change the bucket name and measurement name (it should be 'jmeter' if not modified in the JMeter backend listener), then specify the field or fields you want to retrieve from InfluxDB.
- After updating the query, run your test plan and the query. The selected field data will be displayed as a real-time graph.
- Save this graph to the dashboard by clicking the 'Add to Dashboard' button. You can view the saved dashboards on the dashboard screen and add more graphs to the same dashboard.
4.3 Create Dashboards Using Dashboard Templates
- Navigate to Grafana Dashboards
- Select a dashboard to display JMeter performance metrics
- Copy the dashboard ID or download the JSON file; you can import the dashboard using either option
- Navigate back to Grafana
- Go to "Dashboards" and click "Import" button
- Provide dashboard ID or upload the JSON file then click "Load" button
- In this step update the dashboard name, folder path (if applicable), select the data source, and click the 'Import' button to successfully import the dashboard
5. Summary
This article covered the basics of setting up a pipeline to visualize test data using JMeter, InfluxDB, and Grafana. While this is a foundational setup, it opens the door to powerful insights by transforming raw performance metrics into visual, actionable data.
Feel free to explore further by tweaking queries, adding more complex graphs. Customizing dashboards and experimenting with Flux queries can help you gain deeper insights tailored to your needs.
In the next article, we’ll take this a step further, diving into advanced configurations. This is just the beginning—stay curious and keep experimenting.
6. Reference
- https://grafana.com/grafana/dashboards/?search=jmeter
- https://grafana.com/docs/grafana/latest/getting-started/get-started-grafana-influxdb/
- https://jmeter.apache.org/usermanual/realtime-results.html
- https://docs.influxdata.com/flux/v0/get-started/
💫 Happy testing!💫

